Tracing Retention Graphs to Pivot Game Selections on Emerging Platforms for Consistent Audience Growth
Clara Brooks · Jun 14, 2026
Tracing Retention Graphs to Pivot Game Selections on Emerging Platforms for Consistent Audience Growth
Understanding Retention Graphs in Gaming Analytics
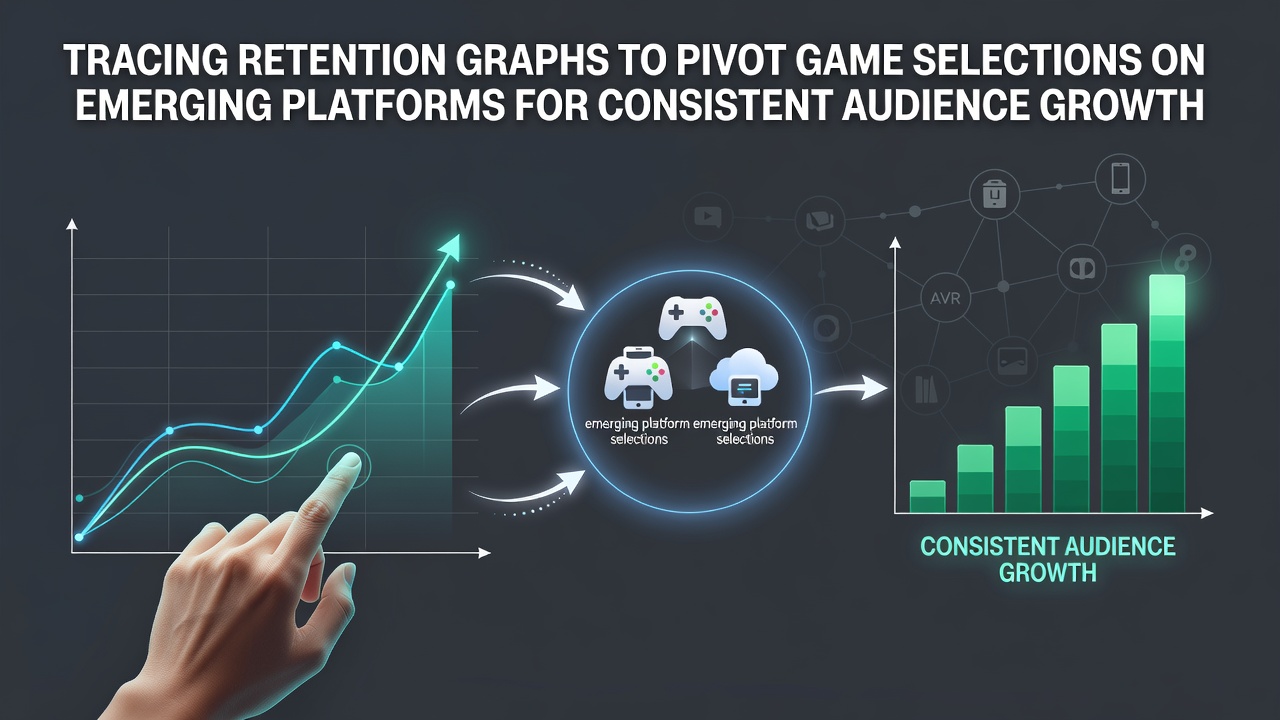
Retention graphs track how long viewers stay engaged with specific game content over time, and developers along with platform operators use these visualizations to identify drop-off points where audiences lose interest during sessions. Data from these graphs reveals patterns such as sharp declines after the first thirty minutes of gameplay or sustained plateaus when certain mechanics hold attention, and analysts examine these metrics across different titles to guide decisions on content direction. In June 2026 several emerging platforms released updated analytics suites that integrate retention data with cross-title comparisons, allowing creators to monitor performance without relying solely on overall view counts.
Platforms collect this information through built-in telemetry that records session duration, interaction frequency, and return rates after initial exposure, while external tools aggregate the figures into line charts and heatmaps for easier interpretation. Observers note that titles with retention curves staying above sixty percent past the one-hour mark tend to support longer-term audience stability compared to those that fall below forty percent early on, and this distinction helps teams decide when to introduce new games or shift focus within existing catalogs.
Identifying Pivot Points Through Data Patterns
Creators examine retention graphs for inflection points where viewer numbers decrease consistently across multiple sessions, and these moments signal opportunities to test alternative game selections on the same platform. Research indicates that games showing repeated early exits often share characteristics like repetitive early levels or unclear progression systems, prompting shifts toward titles with stronger onboarding sequences that maintain higher engagement curves. One study from the University of Melbourne's Digital Media Research Centre examined retention data from over two hundred indie titles and found that pivots executed within the first two weeks of declining metrics preserved audience size more effectively than delayed changes.
Platform operators supply segmented data that breaks retention down by time of day, region, and device type, which allows for targeted adjustments such as scheduling different games during peak hours when specific demographics remain active longer. Figures from industry reports show that consistent monitoring of these segments leads to higher cumulative watch time because creators can align game choices with audience availability patterns rather than relying on broad assumptions about popularity.
Emerging Platforms and Their Analytics Capabilities
New platforms entering the market in 2025 and 2026 often emphasize granular retention tracking as a core feature to attract both creators and viewers seeking fresh content ecosystems, and these services differentiate themselves by offering real-time graph updates that update every fifteen minutes during live sessions. Emerging services integrate with existing game distribution networks to pull performance data directly from titles, reducing the need for manual uploads and enabling faster pivots when metrics indicate waning interest. According to data released by the Entertainment Software Association, platforms with advanced retention tools saw a twenty-eight percent increase in creator migration during the first half of 2026 compared to established services with less detailed analytics.
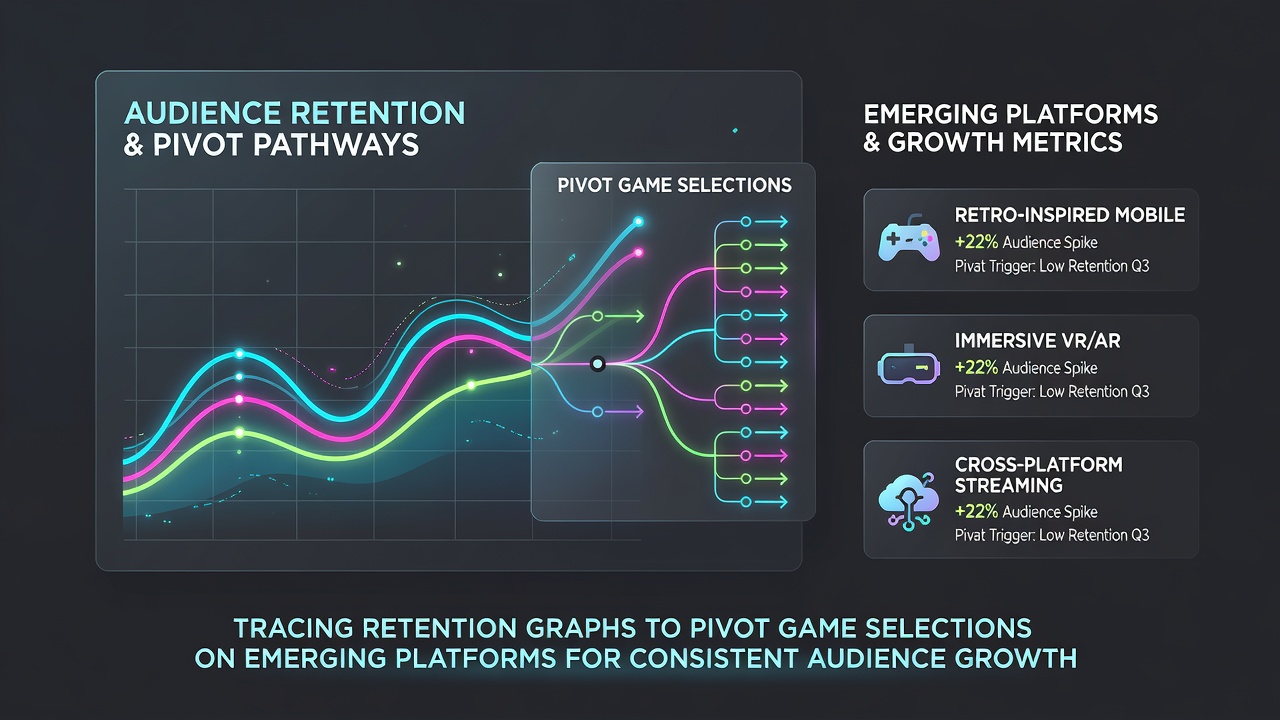
These platforms also provide comparative benchmarks that place individual title performance against category averages, helping creators recognize when their current game selection underperforms relative to similar options available elsewhere. Teams that adopt these benchmarks report quicker identification of replacement titles because the data highlights games that sustain audience attention across comparable session lengths and viewer demographics.
Implementing Game Selection Changes Based on Retention Insights
Successful pivots begin with establishing baseline retention curves for the initial game selection, then testing new titles in controlled segments such as alternate streams or limited-time events to measure improvements in key metrics. Analysts recommend tracking at least three consecutive sessions of the new game before committing to a full switch, because short-term spikes can occur from novelty alone while longer-term retention reveals true audience fit. Data shows that creators who rotate through three to five titles over a month while monitoring retention graphs maintain steadier growth trajectories than those who remain fixed on single selections despite declining curves.
Cross-platform comparisons become relevant when emerging services allow simultaneous broadcasting or content distribution, and retention data helps determine which platform supports higher engagement for particular game genres. Government statistics from Innovation, Science and Economic Development Canada indicate that Canadian gaming creators who diversified across two or more platforms using retention-guided selections experienced average audience increases of eighteen percent year-over-year through mid-2026.
Measuring Long-Term Audience Growth Outcomes
Consistent audience growth correlates with regular review cycles that revisit retention graphs every seven to ten days and adjust game selections accordingly, and this practice prevents prolonged exposure to underperforming titles that erode viewer loyalty. Platforms supply exportable datasets that integrate with third-party visualization software, enabling teams to overlay retention curves from multiple games and spot patterns that single-title analysis might miss. Evidence from academic papers published in the Journal of Gaming and Virtual Worlds demonstrates that data-driven pivots reduce audience churn rates by up to thirty-five percent when implemented within established monitoring frameworks.
Emerging platforms continue to refine their tools with machine learning features that flag potential pivot opportunities automatically, yet human review of the underlying graphs remains essential to account for external factors such as seasonal events or competing releases that temporarily affect retention numbers. Those who integrate these automated alerts with manual verification achieve more reliable growth because they combine algorithmic suggestions with contextual understanding of audience behavior across different game types.
Conclusion
Retention graph analysis provides a structured method for evaluating game selections on emerging platforms, and creators who apply these metrics systematically can sustain audience expansion through informed pivots rather than reactive changes. The combination of detailed platform data, comparative benchmarks, and regular review cycles supports measurable improvements in engagement duration and return rates over extended periods. As new services continue to release enhanced analytics capabilities through 2026, teh practice of tracing retention patterns becomes increasingly central to maintaining consistent growth in competitive digital environments.